February 22, 2018
Bureau of Environment
Results of Tokyo Cap-and-Trade Program in Second Fiscal Year of Second Compliance Period
Covered Facilities Continue Reducing Emissions in Second Compliance Period
In FY2016, emissions from covered facilities amounted to 12.13 million tonnes, achieving a 26% reduction from base-year emissions (a 1% or 120,000-tonne reduction from the previous fiscal year) as a result of aggressive energy efficiency measures. Reductions continue in spite of an increase in gross floor area of 500,000 m2 while emissions per unit of floor area are also decreasing.
Continuing the Program through the second compliance period, the Tokyo Metropolitan Government (TMG) will encourage CO2 reductions to enable all covered facilities to meet their obligations.
Transition of total CO2 emissions from facilities under Tokyo Cap-and-Trade Program
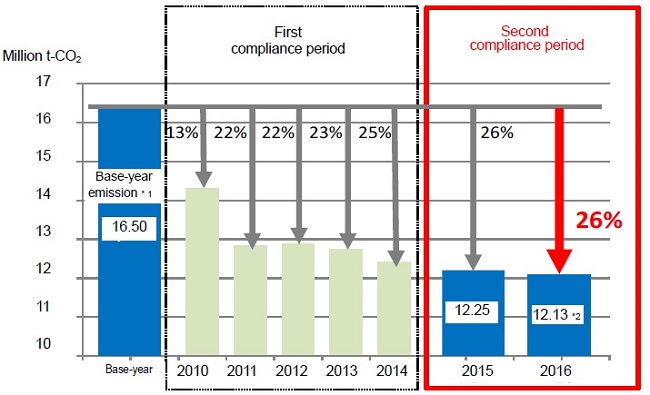
*1 Base-year emissions are the average emissions of three consecutive fiscal years selected by facilities between FY2002-FY2007.
*2 Aggregated value as of January 18, 2018 resulting from emission factors for electricity, etc. in the second compliance period
About the Tokyo Cap-and-Trade Program
In FY2010, TMG started the Tokyo Cap-and-Trade Program for large facilities according to the Tokyo Metropolitan Environmental Security Ordinance.
- Compliance factors
8% or 6% in the first compliance period from FY2010 to FY2014
17% or 15% in the second compliance period from FY2015 to FY2019 - Covered facilities
Approximately 1,200 facilities which have an annual energy usage equivalent to 1,500 kL or more of crude oil
Inquiries
Emission Cap and Trade Section, Climate Change & Energy Division, Bureau of Environment
Phone:+81-3-5388-3465